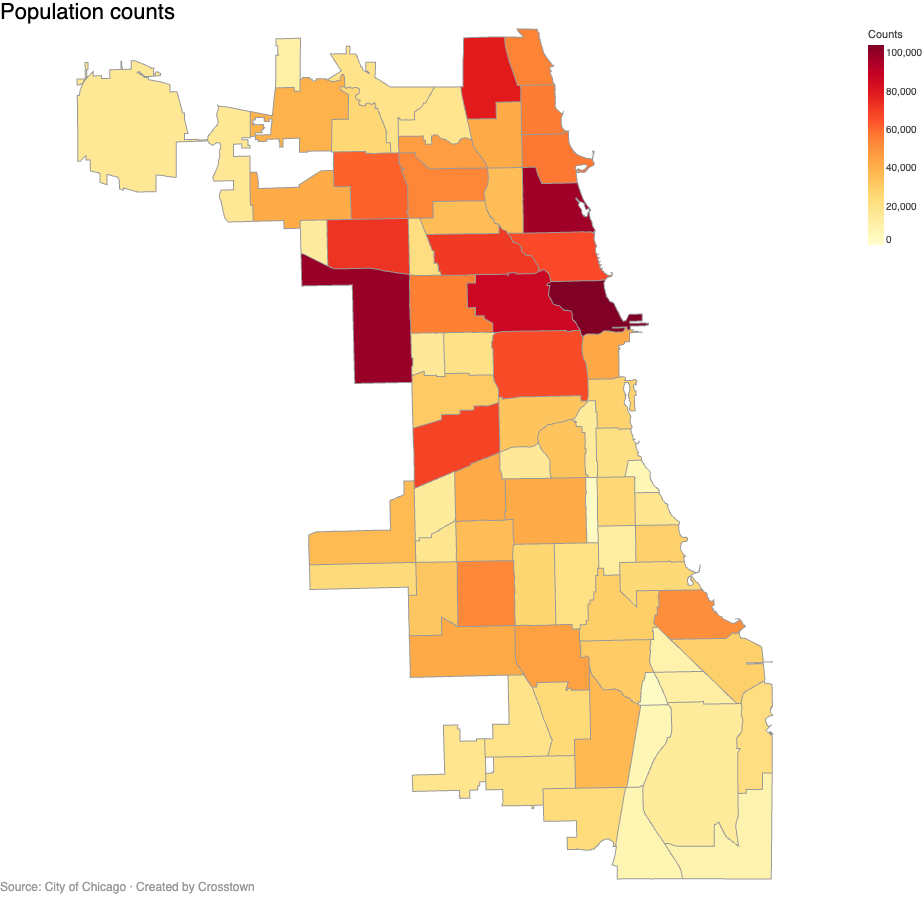
Example PNG Map
PNG charts can be exported directly from the Mixin Browser. You can size the charts in the Mixin Browser. The text size and font used in the legend, title, and axis text, as well as the color scales, can be controlled through the Vega theme.
More examples of PNG and SVG charts
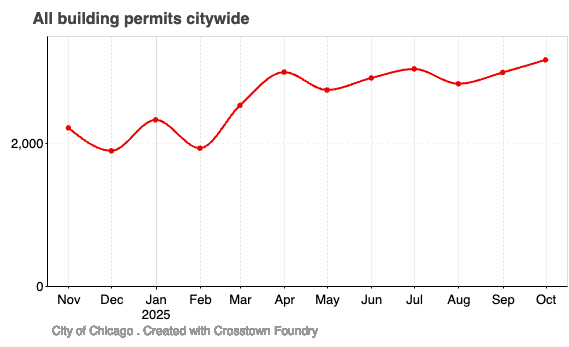
Construction is rising!
You can control the chart width and height.

SVG maps can be resized, but may not display the legend correctly, and are not interactive!
You can export graphs in SVG and customize them before you upload them to your page.
Interactive chart rendered with Vega-Embed.
vegaEmbed usage
🚨 For interactive charts from mixins, you must include in the page as raw HTML
Example interactive chart exported from the Mixin Browser rendered using Vega-Embed.
Interactive map of Chicago crime
Interactive pie chart using a WordPress shortcode.
Interactive Bar chart using WordPress shortcode
Customized Vega spec with ChatGPT
The following content utilizes the Foundry Share HTML feature, with charts as PNG images. Images are stored on the Foundry site. This approach has the following shortcomings.
- If the Story is not published, images will show as broken links!
- If the Story is republished images will show as broken links!
Some stats in Chicago

Fatal injuries citywide

and in Albany Park


Some stats in Chicago
Fatal injuries citywide
and in Albany Park
Charts as Vega Embeds
Content created as stories in Foundry and exported with the Share feature as HTML Body. A Bootstrap layout is used.
Some stats in Chicago and in Albany Park
Bootstrap Grid Example
Column 1
Content for the first column. This will stack below the others on small screens.
Fatal injuries citywide
Column 2
This column is styled using Bootstrap classes like ‘p-3’ (padding) and ‘border’.
Column 3
The total width is 12 units (4+4+4=12), so they fit perfectly in one row.
Nested charts support is upcoming!
Bootstrap Card
This content uses the “card” component and “shadow” utility class.
Story published with images in Base64
Some stats in Chicago and in Albany Park

Bootstrap Grid Example
Column 1
Content for the first column. This will stack below the others on small screens.
Fatal injuries citywide

Column 2
This column is styled using Bootstrap classes like ‘p-3’ (padding) and ‘border’.

Column 3
The total width is 12 units (4+4+4=12), so they fit perfectly in one row.
Nested charts support is upcoming!

Bootstrap Card
This content uses the “card” component and “shadow” utility class.
Story published with images as SVG
Some stats in Chicago and in Albany Park
Bootstrap Grid Example
Column 1
Content for the first column. This will stack below the others on small screens.
Fatal injuries citywide
Column 2
This column is styled using Bootstrap classes like ‘p-3’ (padding) and ‘border’.
Column 3
The total width is 12 units (4+4+4=12), so they fit perfectly in one row.
Nested charts support is upcoming!
Bootstrap Card
This content uses the “card” component and “shadow” utility class.
Custom Slippy Map with Mapbox